Multiple Choice
Identify the
choice that best completes the statement or answers the question.
|
|
|
1.
|
Julie performed the experiment
of drawing a tile from a bag, recording its color, and then returning the tile to the bag. She
performed the experiment 20 times and recorded the results in the line plot below.

Which is the best prediction of the color tile that Julie will pick
next?
a. | Brown | b. | Orange | c. | Purple | d. | Tan |
|
|
|
2.
|
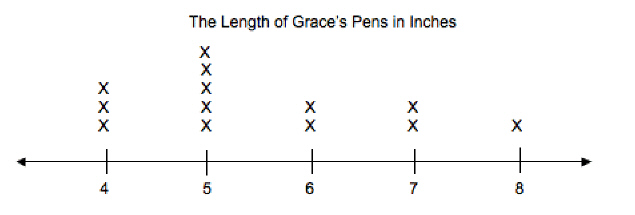
Grace measures all of the pens
in her desk. The line plot shows the lengths of her pens in inches. How many pens does Grace have in
all?
|
|
|
3.
|
Grace measures all of the pens
in her desk. The line plot shows the lengths of her pens in inches. How long is her shortest
pen?

a. | 4
inches | c. | 6
inches | b. | 5 inches | d. | 8 inches |
|
|
|
4.
|
Grace measures all of the pens
in her desk. The line plot shows the lengths of her pens in inches. Which pen length is most
common?

a. | 4
inches | c. | 6
inches | b. | 5 inches | d. | 7 inches |
|
|
|
5.
|
Use the pictograph
below.

How many more marbles does Carl have than Bim?
|
|
|
6.
|
Use the pictograph
below.

Which person has 24 marbles in his
collection?
|
|
|
7.
|
Use the pictograph
below.

Who has the most marbles in his collection?
|
|
|
8.
|
Mrs. Marx kept a tally of the
number of times her children did their chores without being asked. She then made a
pictograph.


How many stars should she put for
Rachel on the pictograph?
a. | 2 | b. |  | c. | 3 | d. |  |
|
|
|
9.
|
Mrs. Ramsey kept a tally of the
number of times her students volunteered to answer questions in class. She then made a
graph.


How
many squares should she shade in for Lee on the graph?
|
|
|
10.
|
Babette surveyed her classmates
to find out their favorite pizza toppings. The results of her survey are shown below.

If each circle equals 2 pizzas, how many circles should mushroom have in the
pictograph?
|
|
|
11.
|
Mrs. Peters kept a tally of the
number of times her children made goals while playing soccer. She then made a
graph.


How many blocks should she shade in for Dana on the
graph?
|
|
|
12.
|
Mr. Perez made a graph for the
results of the Favorite Subjects survey. 2 students voted for math, 3 students voted for science, and
6 students voted for reading. Which graph shows these results correctly?
a. | FAVORITE
SUBJECTS
 | c. | FAVORITE SUBJECTS
 | b. | FAVORITE
SUBJECTS
 | d. | FAVORITE
SUBJECTS
 |
|
|
|
13.
|
Which statement is true about
the data in the graphs?
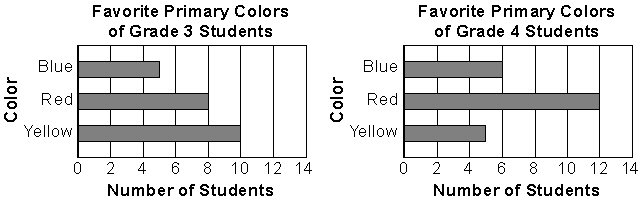
a. | More students in grade 3 than grade
4 favor blue. | b. | Red is the favorite color in both grades. | c. | The number of students who favor yellow in grade 4 is half
the number of students who favor yellow in grade 3. | d. | The number of students who favor red in grade 4 is twice
the number of students who favor red in grade 3. |
|
|
|
14.
|
Which statement is true about
the data in the graphs?

a. | The number of grade 4 students who
play piano is twice the number of grade 3 students who play piano. | b. | The total number of students in both grades who play
clarinet is greater than 10. | c. | The same number of students in both grades play
guitar. | d. | More than half the students in both grades play
guitar. |
|
|
|
15.
|
Danny performed the experiment
of drawing a tile from a bag, recording its color, and then returning the tile to the bag. He
performed the experiment 18 times and recorded the results in the line plot below.

Which color do you predict Danny will NOT pick next?
a. | Blue | b. | Green | c. | Red | d. | Yellow |
|
|
|
16.
|
Heather measured all of the
carrots that she picked from her garden. The line plot shows the lengths of her carrots in inches.
How long is her shortest carrot?

a. | 6
inches | b. | 5 inches | c. | 3 inches | d. | 2 inches |
|
|
|
17.
|
Heather measured all of the
carrots that she picked from her garden. The line plot shows the lengths of her carrots in inches.
Which carrot length is most common?

a. | 5
inches | b. | 6 inches | c. | 7 inches | d. | 8 inches |
|
|
|
18.
|
Use the pictograph
below.

Which person has the most shells?
a. | Todd | b. | Carrie | c. | Sherry | d. | Zack |
|
|
|
19.
|
Use the pictograph
below.

How many more shells does Todd have than
Zack?
|
|
|
20.
|
Mrs. Ramsey kept a tally of the
number of times her students volunteered to answer questions in class. She then made a
pictograph.
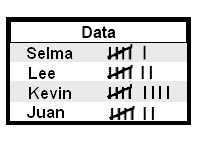

How many
question marks should she put for Selma on the pictograph?
|
|
|
21.
|
Mrs. Conner kept a tally of the
number of times her children skated a mile.


She then made a
pictograph. How many skates should she put for Pam on the pictograph?
a. | 2 | b. |  | c. | 3 | d. |  |
|
|
|
22.
|
Mr. Perez made a graph for the
results of the Favorite Subjects survey. 3 students voted for math, 6 students voted for science, and
2 students voted for reading. Which graph shows these results correctly?
(edit)
a. | FAVORITE
SUBJECTS
 | c. | FAVORITE SUBJECTS
 | b. | FAVORITE
SUBJECTS
 | d. | FAVORITE
SUBJECTS
 |
|
|
|
23.
|
Which statement is true about
the data in the graphs?

a. | The same number of students in both
grades walk to school. | b. | The least number of students in both grades get to school by
car. | c. | The number of students in grade 3 who take a bus is three times the number of
students in grade 4 who get to school by car. | d. | More than half of the total number of students in grades 3
and 4 take a bus. |
|
|
|
24.
|
Which statement is true about
the data in the graphs?

a. | More grade 3 students than grade 4
students chose science. | b. | More grade 4 students than grade 3 students chose
art. | c. | The number of students in grade 3 who chose math is twice the number of
students in grade 4 who chose math. | d. | Most students in both grades chose
art. |
|
|
|
25.
|
Which statement is true about
the data in the graphs?

a. | The same number of students in both
grades like grape juice. | b. | Five fewer grade 3 students than grade 4 students like orange
juice. | c. | Four more grade 4 students than grade 3 students like apple
juice. | d. | The number of students in grade 4 who like orange juice is twice the number of
students in grade 3 who like orange juice. |
|